
U.S. GDP surged an annualized 6.4% in the first quarter (Figure 1). Two rounds of government stimulus helped the economy climb within 0.9% of its all-time high. If expected growth is included, the economy remains 3.7% below pre-COVID trends. Personal income jumped 21.1% from February as a second round of stimulus checks pushed money out to most Americans. Spending increased as well, but not as much as income. Personal consumption rose 4.2%, and services consumption, hindered by COVID concerns, rose only 2.2%.
Key Points for the Week
- Government stimulus programs and reopening efforts helped U.S. GDP grow an annualized 6.4% in the first quarter.
- S&P 500 earnings are expected to grow 45.8%. Strong results from large technology, communication services and consumer discretionary companies pushed estimates significantly higher.
- The Federal Reserve reiterated its commitment to low interest rates and suggested improved supply was a key to leveling out the recent surge in housing prices.
The Federal Reserve left rates unchanged and signaled they will likely remain low. Core inflation rose 0.4% last month but remains below the 2% annual target. Inflation is expected to temporarily surge for a couple months because annual calculations are dropping price declines from the early stages of the pandemic.
S&P earnings reports last week pushed expected first quarter earnings much higher. Earnings are now expected to grow 45.8%, compared to 33.8% last week. But markets had evidently already anticipated the news. The S&P 500 was functionally unchanged. The global MSCI ACWI and Bloomberg BarCap Aggregate Bond Index both dipped 0.2%.
The big news this week will be the April employment report. Based on surveys taken in mid-April, the report will provide evidence of whether the stimulus and reopening measures are pulling people back to work.
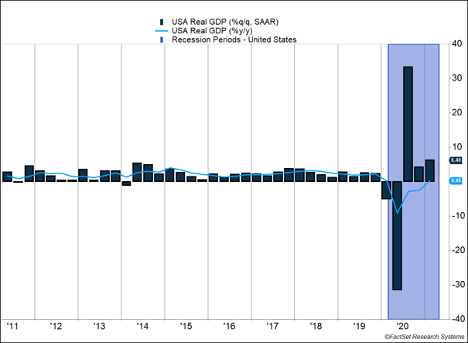
Figure 1
Meeting Elevated Expectations
As America gets ready to celebrate the end of a difficult school year, the U.S. economy has brought home a strong report card of its own. The economic recovery is continuing at a rapid pace. The economic and earnings data reflected the power of stimulus, the importance of reopening, and the efficiency of corporations. All three areas support our view the U.S. economy is well on the road to recovery.
U.S. GDP surged 6.4% in the first quarter. The U.S. annualizes its GDP data, basically assuming the growth rate in the last quarter will continue for a full year. This means a 1.6% actual gain becomes a 6.4% increase in the report.
GDP growth primarily came from consumption, which increased at an annualized 7.0%. Much of the money for the increased spending came from government stimulus programs. A significant portion of aid from the $900 billion stimulus package signed by President Trump arrived in January, and President Biden signed a $1.9 trillion package in March. Sending out checks has proven to be a quick way to get money into people’s accounts and out into the economy.
The importance of reopening was also reflected in the data. March data shows services consumption rose 2.2%, and goods consumption rose 8.1%. Both data points were aided by the additional stimulus. Even though many more people were vaccinated, the growth in services isn’t keeping pace with goods consumption. We expect these numbers to move much closer together as more people are vaccinated.
The nature of stimulus checks likely promotes higher goods spending. Getting $1,400 per person creates an opportunity to make a large purchase, and goods are often more expensive. A reasonable expectation is for the vaccine to boost employment and reopening, causing last month’s 1% gains in employment income to continue and create a services recovery. Goods spending growth will likely slow unless even more stimulus checks are sent out.
Corporate efficiency was also on display last week. Around 30% of the S&P 500 reported earnings, and the results were phenomenal. Earnings growth expectations for the S&P 500 jumped from 33.8% to 45.8% in just one week. Gains from giants in technology, communication services, and consumer discretionary fueled the powerful earnings growth. The gains are primarily driven by companies beating estimated earnings by 22.8%. Normally companies beat analyst estimates by 6.9% on average.
If it was such a good week, why didn’t markets shoot higher? Have you ever known a family that celebrates if one child brings home a 3.0 report card but grills another who brings home a 4.0? Investors need to remember markets look forward and make estimates on how important factors will likely affect the market. Much of the good news was already embedded in the market psyche. When markets expect fantastic results, sometimes fantastic is just not good enough.
—
This newsletter was written and produced by CWM, LLC. Content in this material is for general information only and not intended to provide specific advice or recommendations for any individual. All performance referenced is historical and is no guarantee of future results. All indices are unmanaged and may not be invested into directly. The views stated in this letter are not necessarily the opinion of any other named entity and should not be construed directly or indirectly as an offer to buy or sell any securities mentioned herein. Due to volatility within the markets mentioned, opinions are subject to change without notice. Information is based on sources believed to be reliable; however, their accuracy or completeness cannot be guaranteed. Past performance does not guarantee future results.
S&P 500 INDEX
The Standard & Poor’s 500 Index is a capitalization-weighted index of 500 stocks designed to measure performance of the broad domestic economy through changes in the aggregate market value of 500 stocks representing all major industries.
MSCI ACWI INDEX
The MSCI ACWI captures large- and mid-cap representation across 23 developed markets (DM) and 23 emerging markets (EM) countries*. With 2,480 constituents, the index covers approximately 85% of the global investable equity opportunity set.
Bloomberg U.S. Aggregate Bond Index
The Bloomberg U.S. Aggregate Bond Index is an index of the U.S. investment-grade fixed-rate bond market, including both government and corporate bonds.
https://pure.mpg.de/rest/items/item_2504668/component/file_2520389/content
https://www.bdo.com/insights/tax/federal-tax/new-stimulus-package-passed-december-21-2020
https://www.washingtonpost.com/business/2021/03/10/how-big-is-biden-stimulus/
https://www.bea.gov/news/2021/personal-income-and-outlays-march-2021
https://www.bea.gov/news/2021/gross-domestic-product-first-quarter-2021-advance-estimate
https://www.federalreserve.gov/newsevents/pressreleases/monetary20210428a.htm
https://www.federalreserve.gov/mediacenter/files/FOMCpresconf20210428.pdf
Compliance Case # 01022956
